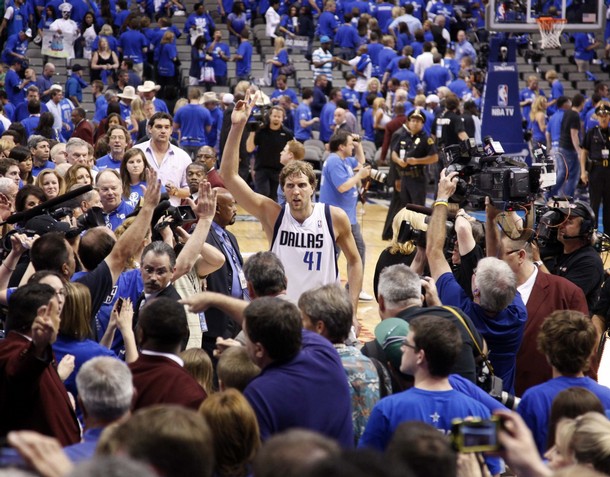
The NBA world was set on fire by Dirk Nowitzki’s scintillating 48 point performance. He was 12-15 from the field and a record 24-24 from the free throw line. Safe to say, we’ve never seen quite the shooting performance like that. ESPN’s Bill Simmons asked how that performance rated in terms of points per miss. Jerod Morris of Midwest Sports Fans took the ball and ran with it and put together a great article around the stat of points per miss (PPM).
However, as intriguing as the concept of points per miss may be, it doesn’t take into account the weighted nature of free throws vs two point field goals vs three point field goals. For instance, Player A can go 5-10 from two point range and have a 5-5 night from the line with a PPM of 3 (15 pts/5 misses). Player B can go 5-5 from three, 0-5 from two, and 0-5 from the line with a PPM of 1.5. Both players had the same number of points (15) from the same number of total attempts (15), but one’s PPM can be skewed due which line a player misses from, etc.
So, how could we come up with a correctly weighted method of measuring the efficiency of a player’s shooting performance? In checking great databases like 82games.com and Basketball Reference, I couldn’t find precisely what I was looking for. There are stats like True Shooting percentage and others, but I was looking for something simple that could explain the league’s best, most effective, and most efficient scorers and shooters.
So, for a simple formula, I thought that this may be a useful method of approach…
Total Points Scored/Total Possible Points Scored
Total Points Possible is fairly simple to come up with, simply (3*3PT FGA) + (2*2PT FGA) + (1*FTA). It’s the maximum possible points a player can score from his attempts at the basket. Think of it like an NBA Slugging Percentage, total shooting percentage, or shooting efficiency statistic. It’s simple and it correctly weights threes vs twos vs free throws for how many points each attempt is worth. The end result is a percentage much like other shooting stats, but takes into accounts a player’s total effectiveness from each area. So, what are the results? You may be surprised to find out…
First, I took a look at the Top 20 scorers from the regular season to discover their total shooting efficiency…
| Player | 2PT FGA | 3 PT FGA | FTA | Total Pts Possible | Total Pts Scored | Total Shooting % | Rank |
| Howard | 1037 | 7 | 916 | 3011 | 1784 | 59.249% | 1 |
| P Gasol | 1117 | 3 | 430 | 2673 | 1541 | 57.651% | 2 |
| Dirk | 1011 | 168 | 443 | 2969 | 1681 | 56.618% | 3 |
| Amare | 1459 | 23 | 597 | 3584 | 1971 | 54.994% | 4 |
| Pierce | 724 | 297 | 449 | 2788 | 1511 | 54.197% | 5 |
| James | 1206 | 279 | 663 | 3912 | 2111 | 53.962% | 6 |
| B Lopez | 1308 | 1 | 489 | 3108 | 1673 | 53.829% | 7 |
| Aldridge | 1392 | 23 | 444 | 3297 | 1769 | 53.655% | 8 |
| Wade | 1178 | 206 | 652 | 3626 | 1941 | 53.530% | 9 |
| Randolph | 1145 | 43 | 396 | 2815 | 1504 | 53.428% | 10 |
| Griffin | 1352 | 24 | 695 | 3471 | 1845 | 53.155% | 11 |
| Jefferson | 1319 | 0 | 289 | 2927 | 1528 | 52.204% | 12 |
| Durant | 1124 | 414 | 675 | 4165 | 2161 | 51.885% | 13 |
| Martin | 808 | 459 | 669 | 3662 | 1876 | 51.229% | 14 |
| Melo | 1252 | 251 | 605 | 3862 | 1970 | 51.010% | 15 |
| Kobe | 1283 | 356 | 583 | 4217 | 2078 | 49.277% | 16 |
| Rose | 1212 | 385 | 555 | 4134 | 2026 | 49.008% | 17 |
| Westbrook | 1387 | 103 | 631 | 3714 | 1793 | 48.277% | 18 |
| Ellis | 1232 | 379 | 431 | 4032 | 1929 | 47.842% | 19 |
| Granger | 853 | 407 | 466 | 3393 | 1622 | 47.804% | 20 |
Some numbers really stand out at first glance, namely how far down the list NBA MVP Derrick Rose and Kobe Bryant rate. Perhaps it’s not a surprise to see players like Carmelo Anthony, Russell Westbrook and Monta Ellis there as well. Unfortunately, the total shooting percentage favors big men, who feast on dunks and layups. 3 of the Top 5 are post players and Brook Lopez ranks above Dwyane Wade. It’s not a perfect stat, but it does well to compare the efficiency of scorers at each position. Who would have thought that Paul Pierce was such an efficient and effective shooter? Even more so than LeBron James. For the record, the league average (total points scored this year in the NBA/total possible points in the NBA) comes out to 48.221% using the numbers from Basketball Reference. So, as far as shooting efficiency goes, Russell Westbrook is only an average performer. Of course, there are several elements to determine a player’s overall effectiveness, but it does reasonably measure shooting numbers.
Here are the top Playoff performers thus far from the Top 10 scorers by points per game in the 2011 postseason…
| Player | 2PT FGA | 3 PT FGA | FTA | Total Pts Possible | Total Pts Scored | Total Shooting % | Rank |
| Howard | 80 | 1 | 88 | 251 | 162 | 64.542% | 1 |
| Dirk | 178 | 20 | 103 | 519 | 313 | 60.308% | 2 |
| Wade | 178 | 25 | 99 | 530 | 280 | 52.830% | 3 |
| Durant | 174 | 84 | 137 | 737 | 387 | 52.510% | 4 |
| Randolph | 216 | 8 | 106 | 562 | 289 | 51.423% | 5 |
| James | 162 | 42 | 96 | 546 | 276 | 50.549% | 6 |
| Kobe | 145 | 41 | 61 | 474 | 228 | 48.101% | 7 |
| Rose | 200 | 78 | 108 | 742 | 345 | 46.496% | 8 |
| Westbrook | 220 | 38 | 107 | 661 | 307 | 46.445% | 9 |
| Melo | 62 | 26 | 34 | 236 | 104 | 44.068% | 10 |
Yipes, sorry Carmelo, I guess that’s one reason why the Knicks were swept out of the first round. Again, Dwight Howard reigns supreme amongst the top scorers, but Dirk Nowitzki’s 60.3% tells the story of his amazing shooting postseason. One can also understand the cries from Oklahoma City for Russell Westbrook (46.4%) to become more facilitator than distributor for Kevin Durant (52.5%) and the Thunder. Also, Dwyane Wade has been a more efficient shooter for the Heat in the Playoffs than LeBron James.
For the record, Dirk Nowitzki’s epic Game 1 performance (12/15 2PT, 0/0 3PT, 24/24 FT) saw his total shooting percentage come in at 88.9%. Kevin Durant, who scored 40 points (8/13 2PT, 2/5 3PT, 18/19 FT) was at 66.7%. Russell Westbrook (3/15 2PT, 0/0 3PT, 14/18 FT) was only 41.6%. Perhaps this stat can put into perspective just how incredible Dirk Nowitzki’s record setting night truly was.
Let us know your thoughts in the comments on these stats and the total shooting percentage and efficiency. Soon, we’ll break down the Top 10 scorers in the league at each position to better compare the top players in the league and see who the most efficient shooters were in the 2010-2011 NBA season.